Compute Model Based Data Basics
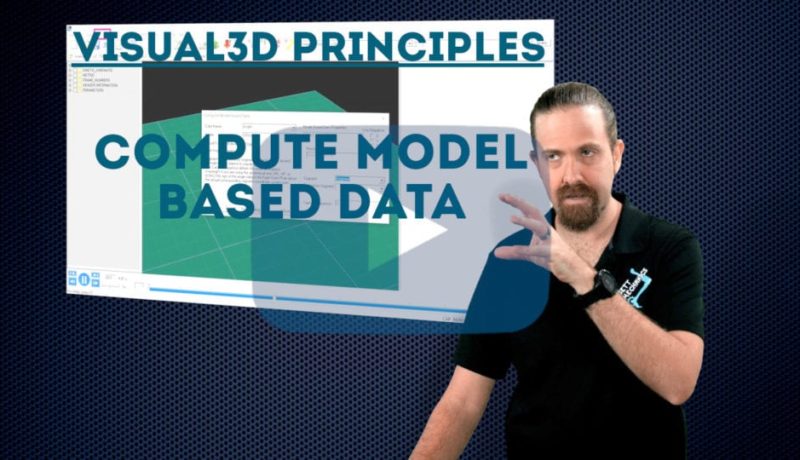
Using Visual3D to calculate biomechanical values from your model is one of the most important features in the software. In this tutorial, we cover the basics of using Compute Model Based Data window.

Using Visual3D to calculate biomechanical values from your model is one of the most important features in the software. In this tutorial, we cover the basics of using Compute Model Based Data window.

Mastering the use of the Compute Model Based Data feature of Visual3D goes a long way to achieving your biomechanical goals. In this tutorial, we focus on the use of the GUI to perform a variety of operations.

A common function within many commands in Visual3D is the threshold. In this tutorial, we explore what a threshold is. An example you might find, is to define events using a threshold.

Each command in a Pipeline can be customized to perform the specific task you need it to. In this tutorial, we give an overview of how to make changes to how a command behaves by using the command editor.

This video introduces the concept of tags in Visual3D and the advantages to using them. Tags are an easy way to categorize your files so that you can easily group them for calculations, pipeline actions, and reports.

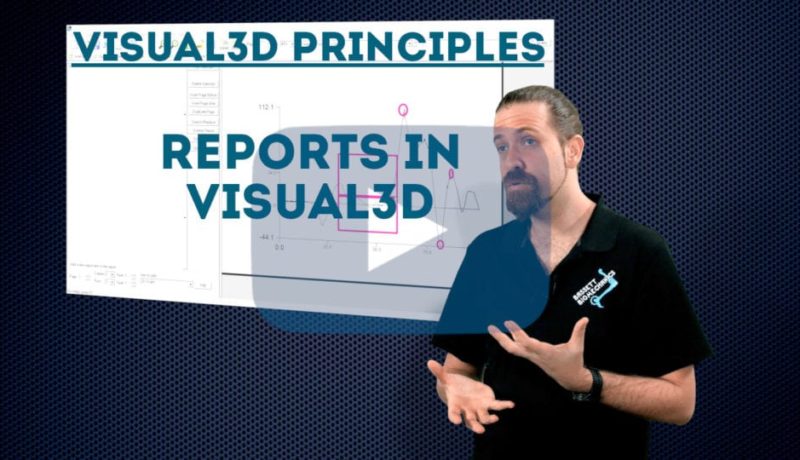
Reporting data is a key part of communicating the findings from your biomechanics lab. This video discusses how you can use the “Reports” tab in Visual3D to create a customized report with the elements you want to analyze.

In this video, we explain the Compute Model Based Data feature in Visual3D and show an example of how to use it. This feature allows you to calculate your data using biomechanical models that have been scientifically validated.

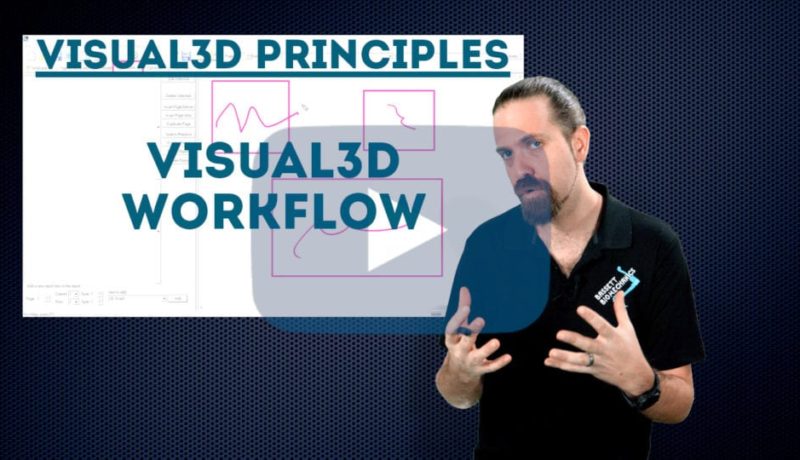
This video walks you through a typical workflow in Visual3D: opening motion files, adding calibration files, defining segments, applying models, processing, creating reports, and outputting data.

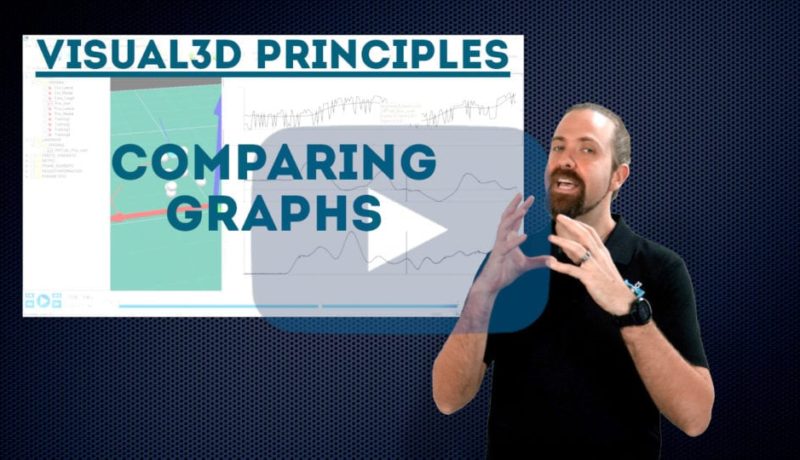
This quick tutorial shows how to compare graphs in Visual3D, which can be useful for quality control or for analyzing the difference between signals. We compare the graphs of a marker and a virtual marker and create a pipeline to calculate the difference between the signals.

This tutorial shows how to define a landmark in 3D space in Visual3D. When you use three points for reference, you can specify offsets along the X, Y, and Z axes, giving you full control over where in virtual space to place your landmark.